Reports
Salesmaster provides a set of reports to help you monitor sales, inventory, and payment trends.
Overview
- Reports menu: open Reports. Use the segmented picker to choose the report period: Daily, Monthly, or Yearly.
- After choosing a segment:
- Daily — pick a specific date.
- Monthly — pick a month (the report will show a day-by-day breakdown for that month).
- Yearly — pick a year (the report will show a month-by-month breakdown for that year).
Summary metrics
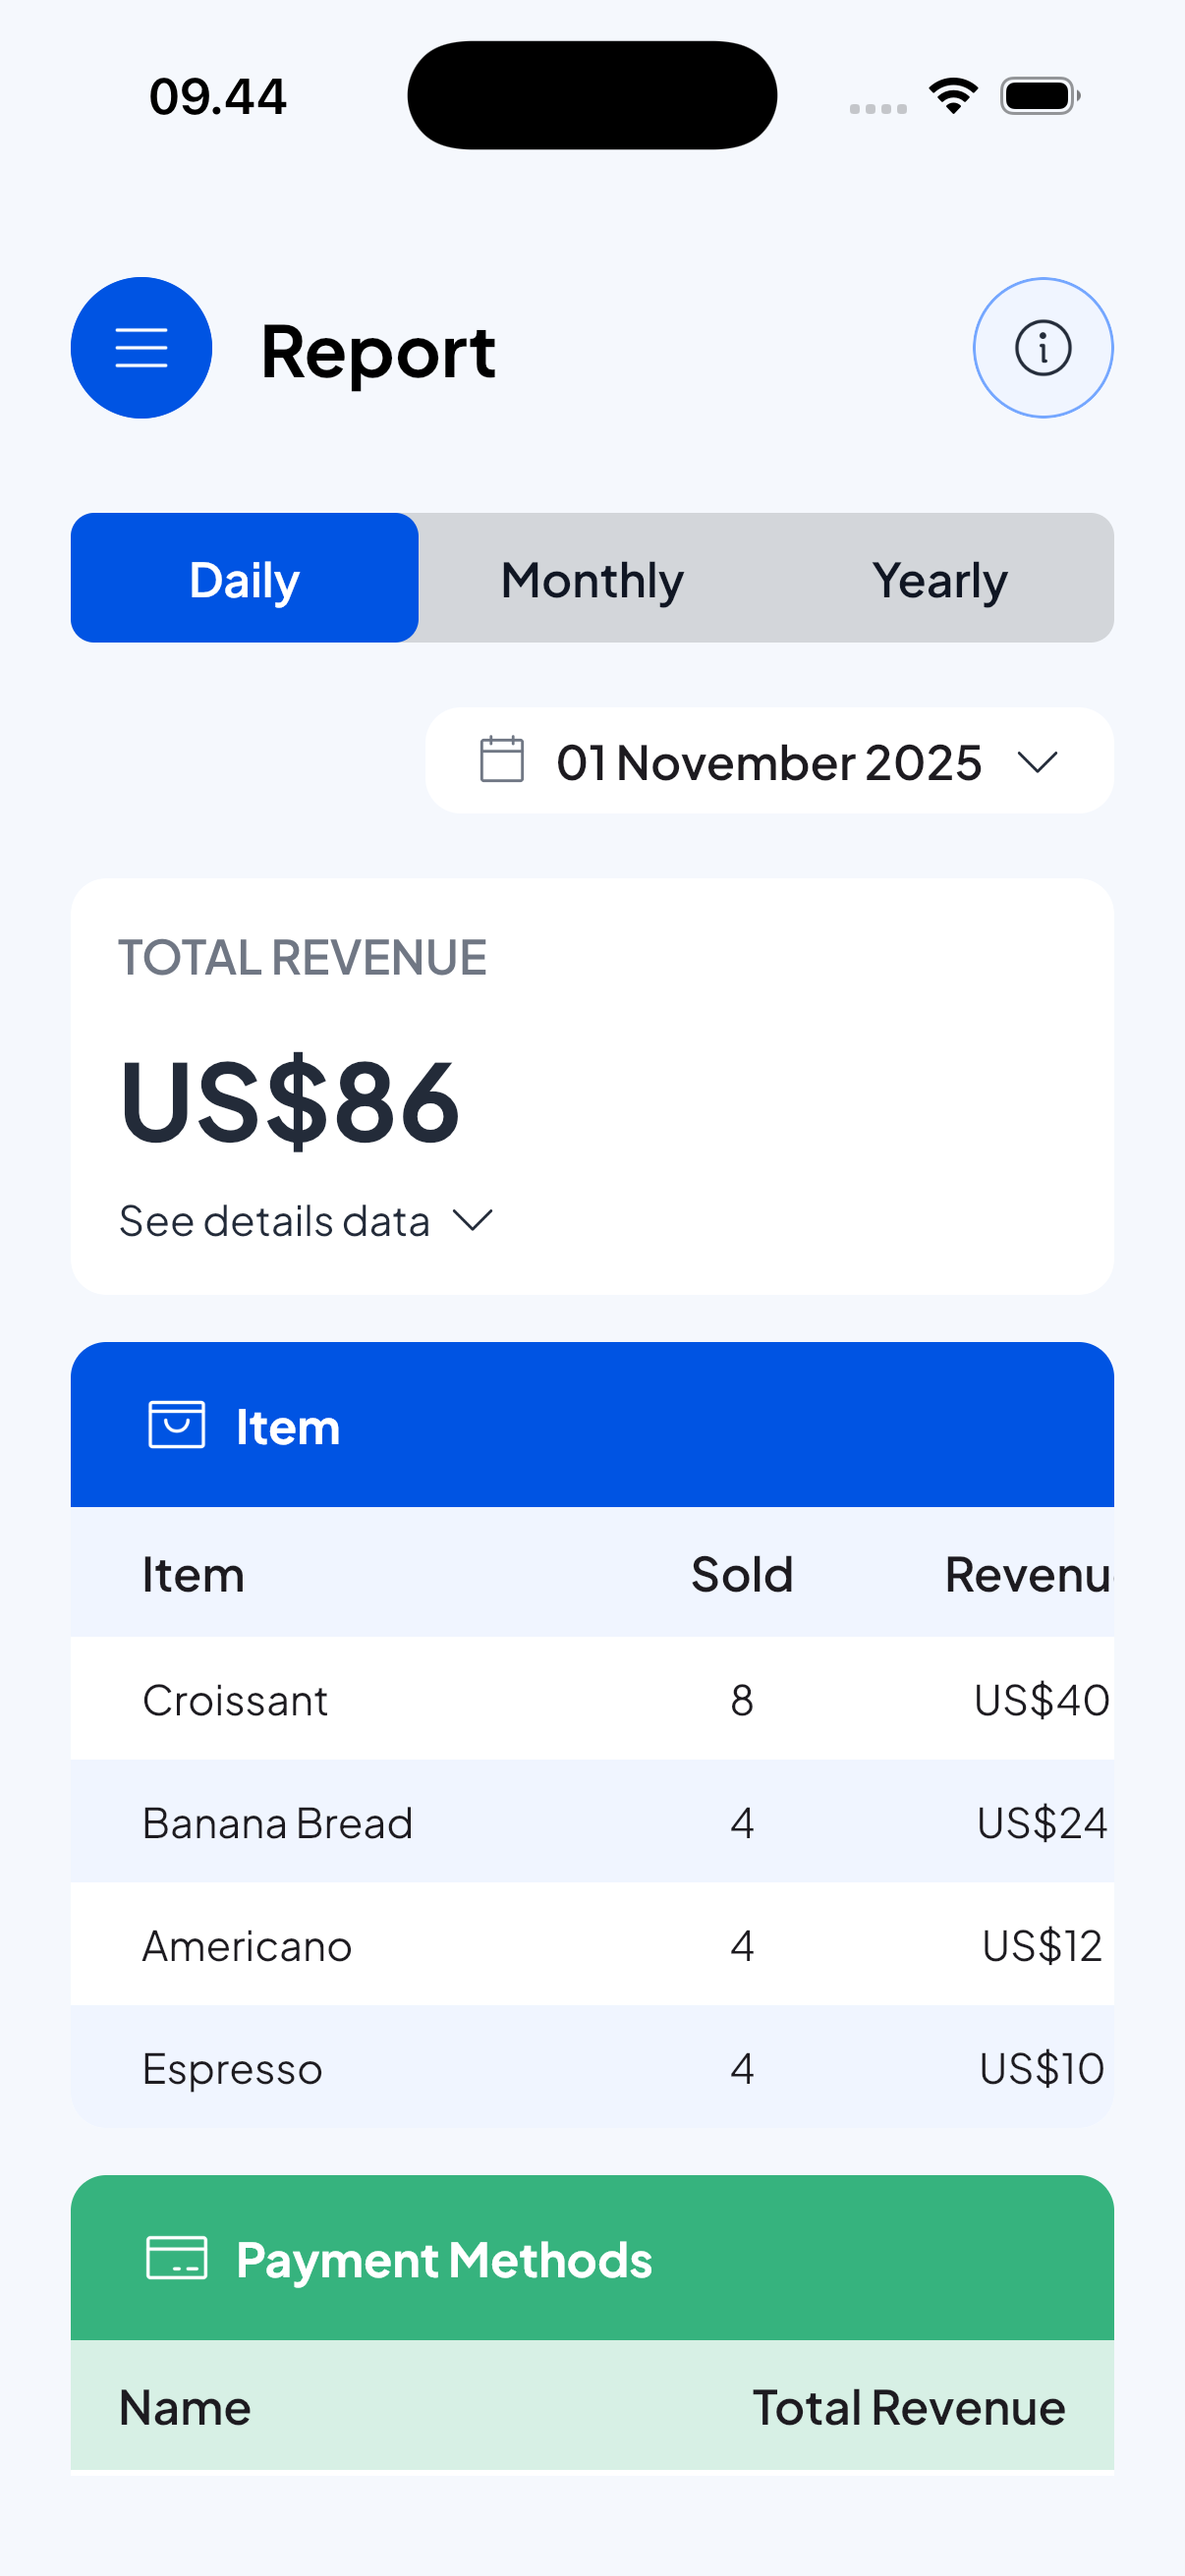
The report shows a single-line total revenue and a breakdown of components. Typical fields:
- Gross sales — total sales before discounts or deductions.
- Discounts — total item-level discounts applied.
- Net sales — gross sales minus discounts.
- Cost of goods sold (COGS) — total cost associated with sold items.
- Gross profit — Net sales minus COGS.
- Tax — total tax collected.
- Net profit — Gross profit minus tax and any other applicable costs.
- Fees — total sale-level fees (service, delivery, packaging).
- Deductions — sale-level deductions or order discounts.
Item-level report
- Below the summary you'll see an items table showing, per item:
- Quantity sold
- Revenue (sales value)
- Cost (COGS for the sold quantity)
- Discounts applied
- Tax collected
- Net revenue for the item
Payment method breakdown
- The report also displays which payment methods generated the most revenue (Top payment method by revenue).
Charts (Monthly & Yearly views)
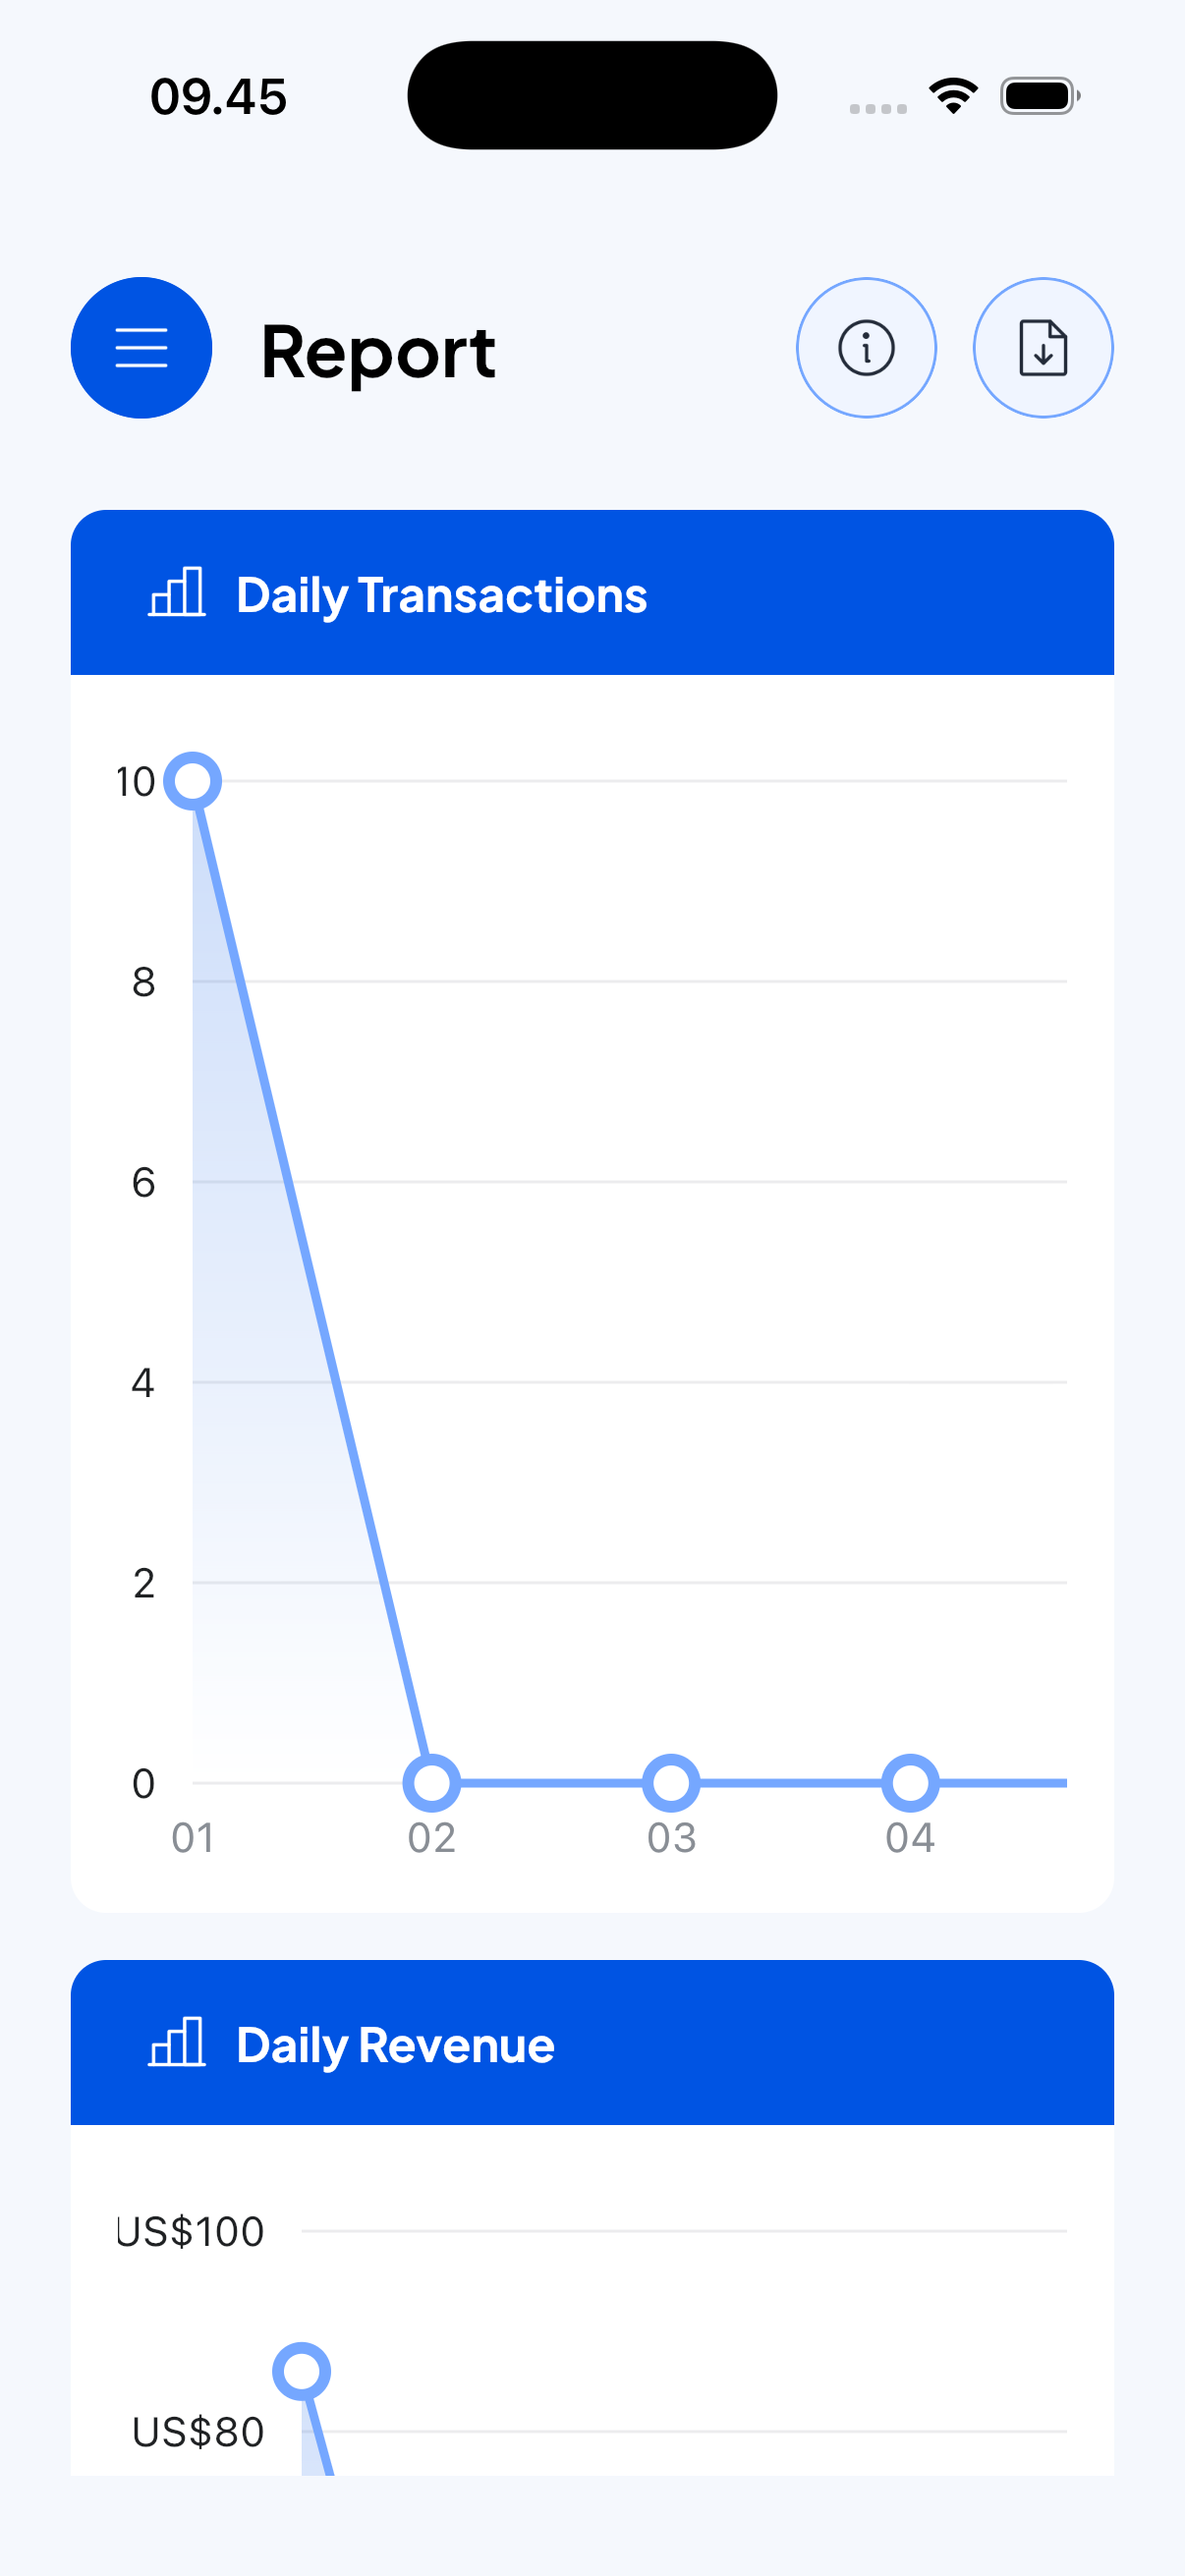
- When Monthly is selected the report shows a day-by-day chart for that month (sales and revenue per day).
- When Yearly is selected the report shows a month-by-month chart for that year (sales and revenue per month).
CSV export
- You can download the report data as CSV. The export includes the summary and item rows so you can analyze it in a spreadsheet or BI tool.
Tips
- Use Monthly view to spot seasonal patterns (which days in a month sell best).
- Use Yearly view to compare months and find growth/decline trends.